Sustainability
A pallet is a carbon store that happens to have a job.
Put numbers against your own volumes
Tell us your annual pallet volume and we will send back the diversion and carbon figures for your specific operation, with the assumptions attached.
- Written quotes, usually inside one business day
- Loads from 100 pallets to full 53' trailers
- We buy as readily as we sell — tell us which way it flows
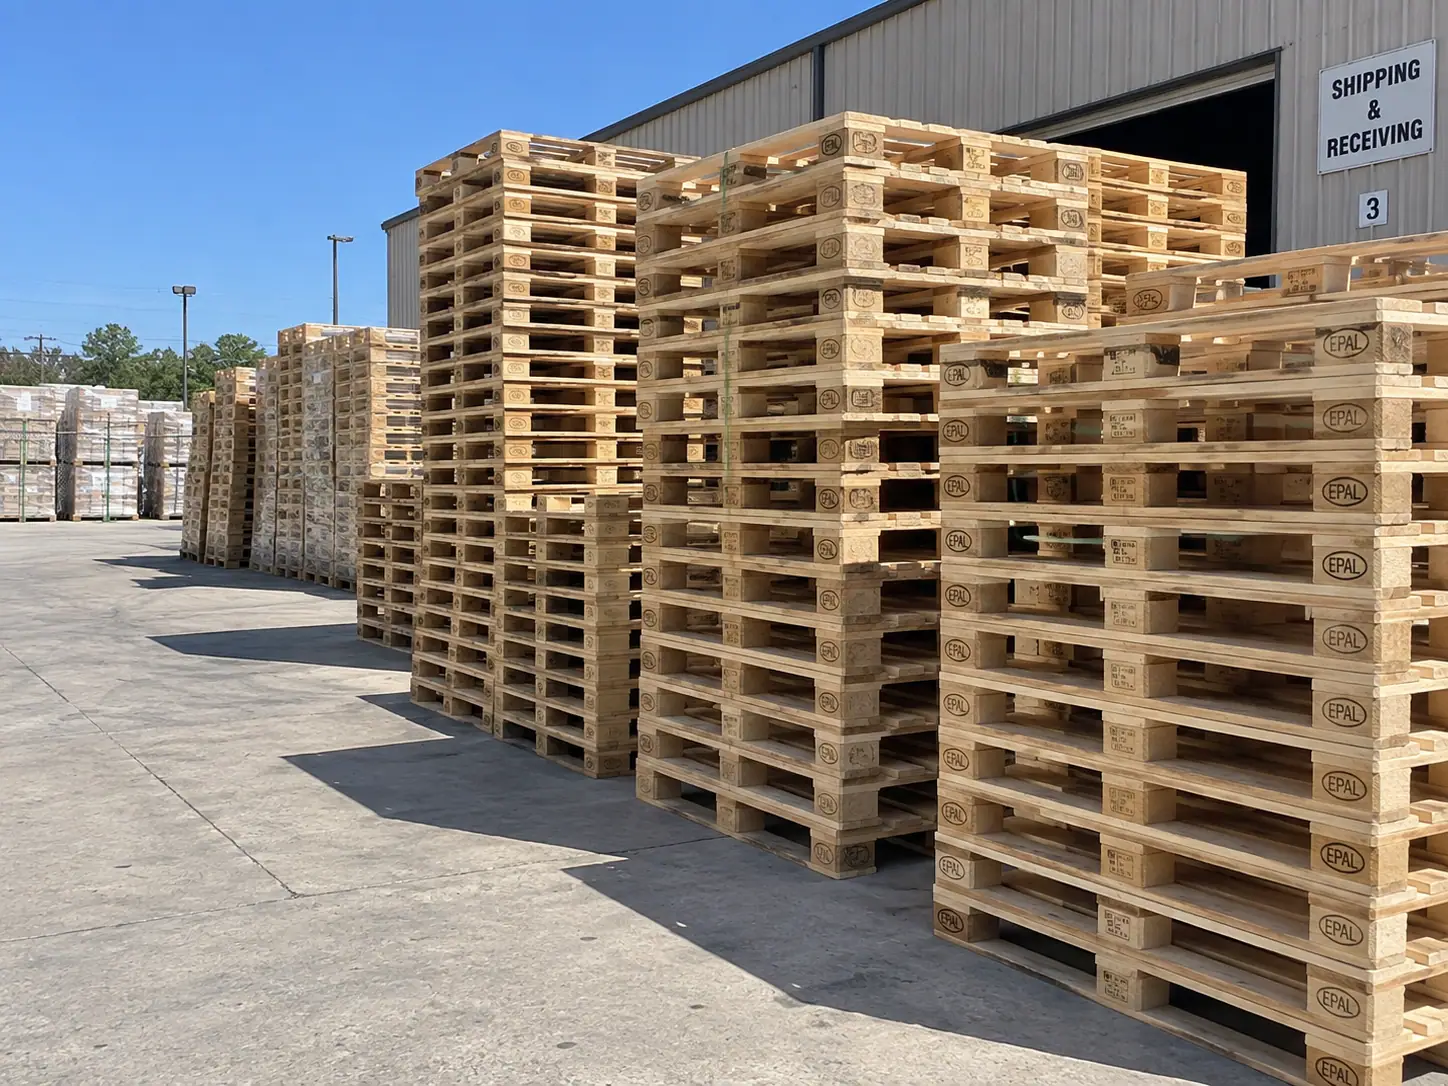
Outbound
Banded, counted and staged against the door. Stacks of fifteen, double-banded, the way a forklift expects them.
There is a great deal of nonsense written about sustainability in this industry, most of it consisting of adjectives. We have tried to take the opposite approach: state the arithmetic, publish the assumptions, and let you check it against your own volumes.
The underlying logic is not complicated. Harvesting, milling and drying lumber is energy-intensive; moving a used pallet forty miles and replacing one board is not. The gap between those two is where the entire environmental case for this business sits, and it is large enough that you do not need to be clever with the numbers to make it work.
What does require care is the waste hierarchy — the order in which you should prefer outcomes. Reuse beats repair, repair beats remanufacture, remanufacture beats grinding, and grinding beats landfill by an enormous margin. Our yard is organised around that order, not around whichever outcome is most convenient on a busy afternoon.
The hierarchy
Five outcomes, in strict order of preference.
- Step 01
Reuse as-is
Cleaned, squared, re-banded and back out. Roughly 34% of intake. The lowest-impact outcome available, by a wide margin.
≈ 0.4 kg CO₂e per unit.
- Step 02
Repair with recovered lumber
Broken members replaced with boards recovered from units beyond saving. About 24% of intake. No new lumber enters the loop.
≈ 1.2 kg CO₂e per unit.
- Step 03
Dismantle and remanufacture
Units past repair become the raw material for other repairs, or get rebuilt into standard footprints. 27% of intake by weight.
This is what makes step two possible.
- Step 04
Grind to fibre
Wet, mouldy or splintered material becomes landscape mulch, animal bedding and boiler fuel. 14% of intake.
Still a product, still displacing a virgin material.
- Step 05
Permitted disposal
Treated and contaminated wood we are not allowed to process. 0.6% of intake, and we publish it.
A stated zero here would be a warning sign.
Run the numbers
The Reclaim Index.
The Reclaim Index
What does your pallet habit actually weigh?
Move the numbers. We’ll show what choosing reclaimed wood over freshly milled lumber does across a year.
That’s 6,000 pallets over twelve months.
92.4
metric tons
CO₂e avoided
135.0
short tons
Kept out of landfill
554
trees
Standing timber spared
$57,000
per year
Not spent on new wood
144,000
board feet
Lumber not milled
256,667
car miles
Equivalent driving avoided
Where the numbers come from
The coefficients, stated plainly.
| Quantity | Value used | Basis | Confidence |
|---|---|---|---|
| Avoided CO₂e per reused 48×40 | 15.4 kg | Cradle-to-gate emissions of an equivalent new pallet | Medium — published LCAs range 10–20 kg |
| Board feet per new 48×40 | 24 bf | Standard GMA construction, nominal dimensions | High |
| Board feet per sawlog tree | 260 bf | Mid-range for a mature hardwood sawlog | Low — varies enormously by stand |
| Weight, recycled 48×40 | 45 lb | Our own scale data, 2025 average | High |
| Carbon content of dry wood | ≈ 50% | Widely accepted figure across forestry literature | High |
| Emissions of recycled unit | 1.2 kg CO₂e | Our collection, sorting and repair energy, 2025 | Medium |
| Car miles per kg CO₂e | 2.78 mi | 0.36 kg CO₂e per passenger-vehicle mile | Medium |
Measured
2025, by the scale.
99.4%
Diversion by weight
Of all wood entering the yard in 2025.
41k tons
Wood recovered
Across the last three calendar years.
78 mi
Median collection radius
Short hauls keep the carbon honest.
0.6%
Landfilled
Treated and contaminated wood only.
What we do not claim
What we are working on
Go deeper
Three pages that show the working.
The Reclaim Index
Calculate the diversion, carbon and cost impact of your own pallet volumes across a year.
OpenEvery coefficient02Carbon methodology
The full derivation, the sources, the uncertainty, and the places where we think the numbers are weakest.
OpenThe 99.4%03Zero-waste promise
How diversion is measured, what evidence we produce, and why a claimed 100% should worry you.
Open